pdv-qrk3: Real-time visualization of data, measurements, KPIs
Using quality control charts, heat maps, trend diagrams, etc., you can monitor and evaluate calculated characteristic values with regard to their temporal quality constancy. Because of the real-time observation during the process of production under consideration of warning and intervention thresholds, pdv-qrk3 is an essential component for sustainable quality control.

Key features
- Display of quality control charts, heat maps, trend diagrams, bar diagrams, etc.
- Monitoring of measured values, process data, quality data, statistics
- Freely configurable views, combination of several panels is possible
- Data migration from different databases
- Slim viewer application for direct display
- Graphics export (save, send)
Based on measured values, characteristic values are at first calculated or facts formed, which then are available for visualization. You can display parameters from different sources in one view, for example energy or environmental data, data from production processes, the laboratory, quality assurance, etc.
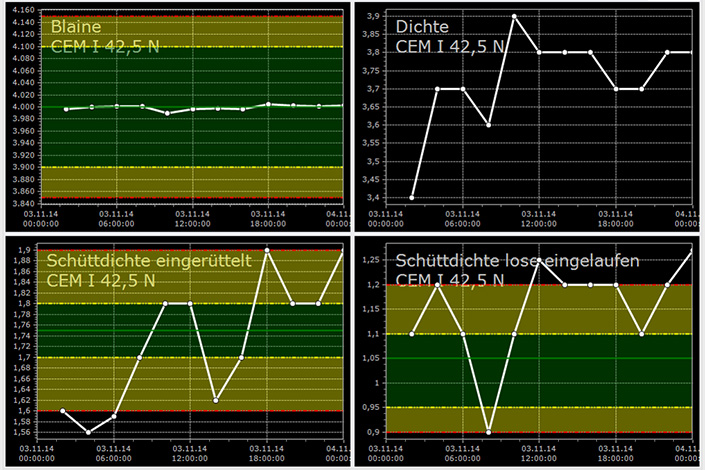
Control charts display the respective key figures as well as the specified thresholds over time. Warning signals indicate violations of thresholds and allow rapid intervention in the production process. Trend graphs combine multiple data series into a single chart so you can easily check correlations. Heatmaps represent any two-dimensional sets of definitions with freely definable color coding. Static content or websites can also be included into the views.
pdv-qrk3 can either be used as a supplementary module to extend the solutions of pdv-software GmbH or as a stand-alone version with appropriate interfaces.
Common view of multiple graphics
With pdv-qrk3 you can combine several different graphics with numerous individual layout options into one view. This allows you to view many key values simultaneously. The views can also be exported as graphic files for further processing or be printed out.
Threshold values for control charts
Control charts display the respective values/indicators as well as the specified thresholds (detection limits, plausibilities, standards, customer specifications) chronologically. Additionally, violations of the defined thresholds can be highlighted by easily noticable alarm symbols. Define all threshold values intended for monitoring individually or obtain them directly from other solutions from pdv-software.
Simple and secure data selection
Using wizards, you can filter out data and key figures from existing databases that are relevant for your view. You select the appropriate visualization suitable for the key figures and set compression, scale and update rate according to your own ideas. A user administration makes it possible to control and monitor the access rights.
Viewer for direct display
The pdv-qrk3 viewer displays the previously created presentations without having to start the application. Thus, the access to the presentation is as simple as possible, the protection of the data at the same time as secure as necessary.
Further Information (in German)
- pdv-qrk3: Neuerungen der aktuellen Version
- Datenblatt pdv-qrk3 - Echtzeit-Visualisierung von Daten, Messungen, KPIs (PDF)
- Data sheet pdv-qrk3 - Real-time visualization of data, measurements, KPIs (PDF, english)
- Hintergrund: Das pdv-portal - mit standardisierten Modulen zur individuellen Software-Lösung


